
SLO
Service level objectives and service level indicators are SRE's primary tools for measuring reliability and tuning our priorities accordingly.
Introduction
Service level indicators
A service level indicator (SLI) is a measurement of a system's behavior. Examples include
- availability: percentage of user requests that are handled error-free, and
- latency: percentage of requests that are completed within a certain deadline,
but might also include metrics particular to a service, like
- freshness: percentage of requests that are served with data less than a certain age, or
- durability: percentage of stored data that is retained over a certain long period.
For each service, we choose a set of SLIs custom-designed to be unambiguous, relevant, and based on available monitoring data.
Service level objectives
A service level objective (SLO) is an SLI combined with a numeric target that represents a satisfactory and achievable user experience. Examples include
- availability: 99.9% of user requests are handled error-free, and
- latency: 99.9% of requests are completed within 250 milliseconds,
and so on.
Each SLO represents the level of reliability we intend to achieve, and every quarter we check our actual performance against those targets. If we do better, that's certainly not a bad thing, although it might mean we can take more risks and deploy new features faster. But if we miss the targets, it means it's time to prioritize reliability work to return to a satisfactory user experience. By agreeing on the SLO in advance, we ensure that we're all on the same page about when that's appropriate.
Error budgets
An error budget is another way of thinking about any SLO: if 99.9% of requests are to succeed, then the remaining 0.1% are allowed to fail. Concretely, if a 99.9% service will receive a billion requests over the quarter, then it's allowed to return up to a million errors during that time, which constitute its error budget.
During outages, requests will fail, consuming part of that error budget—but not exceeding it, if the SLO is upheld. If any errors are left in the budget, they're allowed to be spent on maintenance downtimes, risky deployments, or other potential sources of instability.
(The same concept applies to SLOs that aren't about errors; if the SLO says that 99.9% of requests finish in 250 ms, then 0.1% of requests are budgeted to be slower than that.)
Why isn't the objective 100%?
We'd love it if all our systems responded instantly and worked 100% of the time, but we also know that's unrealistic. By choosing specific objectives based on what is important to our users, we can aim to keep our users happy—and still be able to prioritize other work as long as we're meeting those objectives. If the performance starts to dip down toward the threshold, objectively we know it's time to refocus on short-term reliability work and put other things on hold. And by breaking up our complex production landscape into individual services, each with its own SLOs, we know where to focus that work.
Published SLOs
- etcd main cluster
- API Gateway
- docker-registry
- Varnish caching
- ATS caching
- Logstash
- Search
- WDQS
- HAProxy
- Linkrecommendation
- MariaDB
- EditCheck
Runbook
SLO reporting
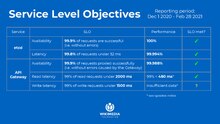
We report on SLOs every quarter, covering a period offset one month earlier than our fiscal quarters—so, December, January, and February make up one SLO reporting quarter. This allows corrective action, when necessary, to be built into the quarterly planning process.
Example:
External links
- Introduction to SLOs at the Wikimedia Foundation - Google Slide Link
- Implementing Service Level Objectives - O'Reilly book - Sample Chapters
- Service Level Objective Intro in Site Reliability Engineering (SRE) book by Google
- Dependency Math at Google
- Meaningful availability - downtime multiplied with the number of users online
- SLO Workshop by Google at SRECon 2018
Additional Keywords: Error Budget, RED Method, four golden signals