
Incidents/2023-02-23 PHP worker threads exhaustion
document status: in-review
Summary
| Incident ID | 2023-02-23 PHP worker threads exhaustion | Start | 17:17 |
|---|---|---|---|
| Task | T330422 | End | 17:42 |
| People paged | 6 (VictorOps incident 1, VictorOps incident 2) | Responder count | 4 |
| Coordinators | Brett Cornwall | Affected metrics/SLOs | |
| Impact | Minimal user-facing errors served | ||
db1127 was too busy to respond even to the simple statistics queries that the mysql prometheus exporter runs. The MariaDB query killer has a bug in 10.6.10 where queries were not properly killed. This was fixed in 10.6.12. db1127 was one of the remaining hosts to still be on 10.6.10.
Timeline
All times in UTC.
- 17:17 - Splunk on-call page
- 17:17 - brett acknowledges
- 17:23 - Page automatically resolved by SYSTEM
- 17:24 - Second page fires
- 17:24 - brett acknowledges
- 17:25 - DBs identified as culprit (
<hnowlan> seems all s7) - 17:26 -
<cdanis> […] we're not [serving many errors] *yet*, but we need to figure out what's causing this and get it to stop - 17:27 - Brett becomes IC
- 17:29 -
<cdanis> […] looks like db1127 is a bit out to lunch - 17:31 - cdanis lowers db1127 weight from 400 to 200 via https://wikitech.wikimedia.org/wiki/Dbctl#Changing_weights_for_a_host (<+logmsgbot> !log cdanis@cumin1001 dbctl commit (dc=all): 'db1127 running very hot', diff saved to https://phabricator.wikimedia.org/P44752 and previous config saved to /var/cache/conftool/dbconfig/20230223-173127-cdanis.json)
- 17:32 -
<cdanis> if it doesn't improve shortly I'll depool it entirely - 17:33 -
<cdanis> […] I think it's mostly under control probably - 17:36 - cdanis depools db1127 entirely (
<+logmsgbot> !log cdanis@cumin1001 dbctl commit (dc=all): 'so hot right now', diff saved to https://phabricator.wikimedia.org/P44753 and previous config saved to /var/cache/conftool/dbconfig/20230223-173608-cdanis.json) - 17:42 - Errors drop to pre-incident rates
Detection
Automated alert via VictorOps:
Critical: PHPFPMTooBusy api_appserver (php7.4-fpm.service eqiad)

https://grafana.wikimedia.org/d/RIA1lzDZk/application-servers-red-dashboard?panelId=54&fullscreen&orgId=1&from=now-3h&to=now&var-datasource=eqiad%20prometheus/ops&var-cluster=api_appserver The MediaWiki cluster api_appserver in eqiad is experiencing saturation of php7.4-fpm.service workers 9.851% https://bit.ly/wmf-fpmsat Not enough idle php7.4-fpm.service workers for Mediawiki api_appserver at eqiad #page
Alerts Firing:
Labels:
 - alertname = PHPFPMTooBusy
 - cluster = api_appserver
 - prometheus = ops
 - service = php7.4-fpm.service
 - severity = page
 - site = eqiad
 - source = prometheus
 - team = sre
Annotations:
 - dashboard = https://grafana.wikimedia.org/d/RIA1lzDZk/application-servers-red-dashboard?panelId=54&fullscreen&orgId=1&from=now-3h&to=now&var-datasource=eqiad%20prometheus/ops&var-cluster=api_appserver
 - description = The MediaWiki cluster api_appserver in eqiad is experiencing saturation of php7.4-fpm.service workers 9.851%
 - runbook = https://bit.ly/wmf-fpmsat
 - summary = Not enough idle php7.4-fpm.service workers for Mediawiki api_appserver at eqiad #page
Source: https://prometheus-eqiad.wikimedia.org/ops/graph?g0.expr=sum+by%28cluster%2C+service%29+%28phpfpm_statustext_processes%7Bcluster%3D~%22%28api_appserver%7Cappserver%7Cparsoid%29%22%2Cstate%3D%22idle%22%7D%29+%2F+sum+by%28cluster%2C+service%29+%28phpfpm_statustext_processes%7Bcluster%3D~%22%28api_appserver%7Cappserver%7Cparsoid%29%22%7D%29+%3C%3D+0.3&g0.tab=1
Graphs
-
 MySQL global status threads
 -
 DB worst response times
 -
 DB open connections
 -
 DB open connections
 -
 PHP active vs idle workers
 -
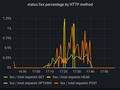 5XX percentage by HTTP method
 -
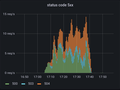 5XX status codes


Conclusions
What went well?
- Detection of the issue
- Identification of the issue
- Remedy of the issue before it became a larger problem
What went poorly?
Where did we get lucky?
Links to relevant documentation
Actionables
- Report this issue upstream (MDEV-30760)
 Done
Done
Scorecard
| Question | Answer
(yes/no) |
Notes | |
|---|---|---|---|
| People | Were the people responding to this incident sufficiently different than the previous five incidents? | yes | |
| Were the people who responded prepared enough to respond effectively | yes | ||
| Were fewer than five people paged? | no | ||
| Were pages routed to the correct sub-team(s)? | yes | ||
| Were pages routed to online (business hours) engineers? Answer “no” if engineers were paged after business hours. | yes | ||
| Process | Was the "Incident status" section atop the Google Doc kept up-to-date during the incident? | yes | |
| Was a public wikimediastatus.net entry created? | no | ||
| Is there a phabricator task for the incident? | yes | https://phabricator.wikimedia.org/T330422 | |
| Are the documented action items assigned? | yes | ||
| Is this incident sufficiently different from earlier incidents so as not to be a repeat occurrence? | yes | ||
| Tooling | To the best of your knowledge was the open task queue free of any tasks that would have prevented this incident? Answer “no” if there are
open tasks that would prevent this incident or make mitigation easier if implemented. |
yes | |
| Were the people responding able to communicate effectively during the incident with the existing tooling? | yes | ||
| Did existing monitoring notify the initial responders? | yes | ||
| Were the engineering tools that were to be used during the incident, available and in service? | yes | ||
| Were the steps taken to mitigate guided by an existing runbook? | no | ||
| Total score (count of all “yes” answers above) | 12 | ||