
Incidents/2023-02-11 logstash latency
document status: draft
Summary
| Incident ID | 2023-02-11 logstash latency | Start | 2023-02-11 10:44 |
|---|---|---|---|
| Task | T331461 | End | 2023-02-11 12:58 |
| People paged | 0 | Responder count | 0 |
| Coordinators | n/a | Affected metrics/SLOs | Logstash's latency SLO in eqiad was affected. |
| Impact | Logstash messages were delayed for 2h14m. At peak (10:58), up to 45% of messages were delayed. | ||
eqiad's Logstash experienced message congestion that exhausted the latency budget. This incident consumed 160% of the quarterly budget for delayed messages.
Timeline
Write a step by step outline of what happened to cause the incident, and how it was remedied. Include the lead-up to the incident, and any epilogue.
Consider including a graphs of the error rate or other surrogate.
All times in UTC.
- TODO: Triggering event for the Parsoid errors.
- 10:41 Beginning of a flood of exceptions logged from Parsoid, with message:
[92ed9dea-d7d4-4b36-9398-202a2e4ccb4c] /w/rest.php/www.mediawiki.org/v3/page/pagebundle/Extension%3ATemplateStylesExtender/5769267 PHP Notice: Trying to get property 'nextSibling' of non-object(logstash) - 10:44 As events accumulate on the Kafka queue faster than Logstash can consume them, the fraction of events affected by consumer lag (measured by Burrow) rises from its normal value of zero. (dashboard) OUTAGE BEGINS
- 10:45 Alert fires: (LogstashKafkaConsumerLag) firing: Too many messages in kafka logging (IRC)
- 10:49 Exception logging hits its peak: 54.6k messages/sec.
- 10:54 Last exception is logged from Parsoid. In total, 8,643,149 messages were logged. Logstash continues to work through the queue. (logstash)
- 10:58 Kafka lag hits its peak: 45.8% of messages are lagged. (dashboard)
- 12:55 Alert resolves: (LogstashKafkaConsumerLag) resolved: Too many messages in kafka logging (IRC)
- 12:56 The last backlogged Parsoid events are processed, and the fraction of lagged events returns to zero. (dashboard) OUTAGE ENDS
-
 Parsoid fatals
 -
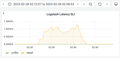 Logstash latency

Detection
One IRC-only alert fired:
[10:45:55] <jinxer-wm> (LogstashKafkaConsumerLag) firing: Too many messages in kafka logging - https://wikitech.wikimedia.org/wiki/Logstash#Kafka_consumer_lag - https://grafana.wikimedia.org/d/000000484/kafka-consumer-lag?var-cluster=logging-eqiad&var-datasource=eqiad%20prometheus/ops - https://alerts.wikimedia.org/?q=alertname%3DLogstashKafkaConsumerLag
It was Saturday, and there was no page, so nobody saw or responded to the alert. The problem wasn't noticed until the end of the SLO quarter, when we discovered in the normal reporting process that Logstash had missed its latency SLO in eqiad.
Conclusions
OPTIONAL: General conclusions (bullet points or narrative)
What went well?
- …
OPTIONAL: (Use bullet points) for example: automated monitoring detected the incident, outage was root-caused quickly, etc
What went poorly?
- …
OPTIONAL: (Use bullet points) for example: documentation on the affected service was unhelpful, communication difficulties, etc
Where did we get lucky?
- …
OPTIONAL: (Use bullet points) for example: user's error report was exceptionally detailed, incident occurred when the most people were online to assist, etc
Links to relevant documentation
Add links to information that someone responding to this alert should have (runbook, plus supporting docs). If that documentation does not exist, add an action item to create it.
Actionables
- TODO: Decide whether to include an action item for a paging alert on Kafka lag/backlog
- ...
Create a list of action items that will help prevent this from happening again as much as possible. Link to or create a Phabricator task for every step.
Add the #Sustainability (Incident Followup) and the #SRE-OnFIRE (Pending Review & Scorecard) Phabricator tag to these tasks.
Scorecard
| Question | Answer
(yes/no) |
Notes | |
|---|---|---|---|
| People | Were the people responding to this incident sufficiently different than the previous five incidents? | yes | No one was paged or responded at the time of the incident. These answers are a best effort for that situation, based on the intent of the questions. (E.g., here, "yes" because the incident didn't contribute to burning anyone out.) |
| Were the people who responded prepared enough to respond effectively | no | ||
| Were fewer than five people paged? | yes | ||
| Were pages routed to the correct sub-team(s)? | no | ||
| Were pages routed to online (business hours) engineers? Answer “no” if engineers were paged after business hours. | yes | ||
| Process | Was the "Incident status" section atop the Google Doc kept up-to-date during the incident? | no | |
| Was a public wikimediastatus.net entry created? | no | But one wouldn't have been appropriate, even if we had responded -- Logstash is critical SRE-facing infrastructure but is not user-facing. | |
| Is there a phabricator task for the incident? | yes | ||
| Are the documented action items assigned? | not yet | ||
| Is this incident sufficiently different from earlier incidents so as not to be a repeat occurrence? | yes | ||
| Tooling | To the best of your knowledge was the open task queue free of any tasks that would have prevented this incident? Answer “no” if there are
open tasks that would prevent this incident or make mitigation easier if implemented. |
yes | |
| Were the people responding able to communicate effectively during the incident with the existing tooling? | yes | ||
| Did existing monitoring notify the initial responders? | no | ||
| Were the engineering tools that were to be used during the incident, available and in service? | ? | Blank for now because I'm not sure. Logstash itself would have been a key debugging tool, and mid-incident it would have shown the culprit messages but at a long delay; between 10:54 and 12:55, we wouldn't have known that the flood was over. But maybe other tools would have had that information available. | |
| Were the steps taken to mitigate guided by an existing runbook? | no | ||
| Total score (count of all “yes” answers above) | 7 | ||