Incidents/2022-12-09 api appserver worker starvation
document status: in-review
Summary
| Incident ID | 2022-12-09 api appserver worker starvation | Start | 2022-12-09 15:04:13 |
|---|---|---|---|
| Task | T324994 | End | 2022-12-09 16:36:17 |
| People paged | 2 | Responder count | 5 |
| Coordinators | claime (retroactive) | Affected metrics/SLOs | api_appserver latency was degraded around the starvation point |
| Impact | No user-facing impact. | ||
…
Increased mediawiki logging led to eventgate-analytics congestion, starving the api_appservers of idle workers. No user-facing impact.
Timeline
All times in UTC.
2022-12-09 13:13:00 <hashar@deploy1002> rebuilt and synchronized wikiversions files: all wikis to 1.40.0-wmf.13 refs T320518
2022-12-09 15:04:13 Incident start
2022-12-09 15:04:13 [+icinga-wm] PROBLEM - Some MediaWiki servers are running out of idle PHP-FPM workers in api_appserver at eqiad on alert1001 is CRITICAL: 0.5645 gt 0.3 https://bit.ly/wmf-fpmsat https://grafana.wikimedia.org/d/fRn9VEPMz/application-servers-use-dashboard-wip?orgId=1
2022-12-09 15:09:47 [+icinga-wm] RECOVERY - Some MediaWiki servers are running out of idle PHP-FPM workers in api_appserver at eqiad on alert1001 is OK: (C)0.3 gt (W)0.1 gt 0.09677 https://bit.ly/wmf-fpmsat https://grafana.wikimedia.org/d/fRn9VEPMz/application-servers-use-dashboard-wip?orgId=1


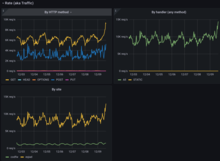
2022-12-09 15:16:03 claime starts investigating a possible increase in calls Idle workers 7 days RED Initial working hypothesis is that the increase is caused by train deployment of 1.40.0-wmf.13 to all wikis
2022-12-09 15:50:31 [+icinga-wm] PROBLEM - Some MediaWiki servers are running out of idle PHP-FPM workers in api_appserver at eqiad on alert1001 is CRITICAL: 0.4194 gt 0.3 https://bit.ly/wmf-fpmsat https://grafana.wikimedia.org/d/fRn9VEPMz/application-servers-use-dashboard-wip?orgId=1
2022-12-09 15:56:18 jayme remarks that the situation is getting worse, pings Amir
2022-12-09 15:59:47 [+icinga-wm] RECOVERY - Some MediaWiki servers are running out of idle PHP-FPM workers in api_appserver at eqiad on alert1001 is OK: (C)0.3 gt (W)0.1 gt 0.03226 https://bit.ly/wmf-fpmsat https://grafana.wikimedia.org/d/fRn9VEPMz/application-servers-use-dashboard-wip?orgId=1


2022-12-09 15:59:49 Amir compares flamegraphs between 2022-12-09_14 and 2022-12-09_10 eventbus is pegged as a potential bottleneck, ottomata tagged in
2022-12-09 16:04:56 jayme remarks that logstash is dropping messages
2022-12-09 16:18:21 [+icinga-wm] PROBLEM - Some MediaWiki servers are running out of idle PHP-FPM workers in api_appserver at eqiad on alert1001 is CRITICAL: 0.3871 gt 0.3 https://bit.ly/wmf-fpmsat https://grafana.wikimedia.org/d/fRn9VEPMz/application-servers-use-dashboard-wip?orgId=1
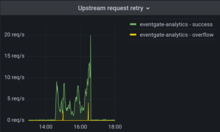
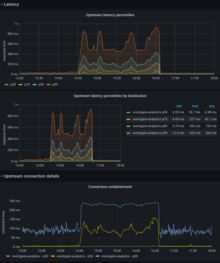
2022-12-09 16:21:17 cdanis spots upstream errors, retries and connection fail rates in envoy telemetry as well as latencies in eventgate eqiad POST p99
2022-12-09 16:23:53 [+icinga-wm] PROBLEM - Some MediaWiki servers are running out of idle PHP-FPM workers in api_appserver at eqiad on alert1001 is CRITICAL: 0.6613 gt 0.3 https://bit.ly/wmf-fpmsat https://grafana.wikimedia.org/d/fRn9VEPMz/application-servers-use-dashboard-wip?orgId=1
2022-12-09 16:27:32 ottomata spots pod cpu throttling in eventgate deployment
2022-12-09 16:28:10 Decision made to increase pod replicas for eventgate-analytics to 30
2022-12-09 16:29:24 Amir hypothesises the increase in logs caused by mobile load.php (T324723) might have been a contributing factor
2022-12-09 16:31:17 [PAGE] (PHPFPMTooBusy) firing: Not enough idle php7.4-fpm.service workers for Mediawiki api_appserver at eqiad #page - https://bit.ly/wmf-fpmsat - https://grafana.wikimedia.org/d/RIA1lzDZk/application-servers-red-dashboard?panelId=54&fullscreen&orgId=1&from=now-3h&to=now&var-datasource=eqiad%20prometheus/ops&var-cluster=api_appserver - https://alerts.wikimedia.org/?q=alertname%3DPHPFPMTooBusy
2022-12-09 16:35:12 ottomata bumps eventgate-analytics replicas to 30
2022-12-09 16:36:17 [RECOVERY] (PHPFPMTooBusy) resolved: Not enough idle php7.4-fpm.service workers for Mediawiki api_appserver at eqiad #page - https://bit.ly/wmf-fpmsat - https://grafana.wikimedia.org/d/RIA1lzDZk/application-servers-red-dashboard?panelId=54&fullscreen&orgId=1&from=now-3h&to=now&var-datasource=eqiad%20prometheus/ops&var-cluster=api_appserver - https://alerts.wikimedia.org/?q=alertname%3DPHPFPMTooBusy


2022-12-09 16:36:55 [+icinga-wm] RECOVERY - Some MediaWiki servers are running out of idle PHP-FPM workers in api_appserver at eqiad on alert1001 is OK: All metrics within thresholds. https://bit.ly/wmf-fpmsat https://grafana.wikimedia.org/d/fRn9VEPMz/application-servers-use-dashboard-wip?orgId=1
2022-12-09 16:44:49 claime remarks %worker in active state still a little high compared to baseline, but not by much.
2022-12-09 16:44:49 Incident closed.
Detection
Issue detected through monitoring of api_appserver idle starvation. The alerts were accurate as to the symptom, but not the actual cause (eventgate-external pods getting CPU throttled).
Alerts
[+icinga-wm] PROBLEM - Some MediaWiki servers are running out of idle PHP-FPM workers in api_appserver at eqiad on alert1001 is CRITICAL: 0.5645 gt 0.3
[PAGE] (PHPFPMTooBusy) firing: Not enough idle php7.4-fpm.service workers for Mediawiki api_appserver at eqiad #page - https://grafana.wikimedia.org/d/RIA1lzDZk/application-servers-red-dashboard?panelId=54&fullscreen&orgId=1&from=now-3h&to=now&var-datasource=eqiad%20prometheus/ops&var-cluster=api_appserver - https://alerts.wikimedia.org/?q=alertname%3DPHPFPMTooBusy
Conclusions
What went well?
- Incident caught by monitoring
- People with the different "platform specific" knowledge were around to debug
- Combining debugging resources between mediawiki through flamegraph, api_appserver, envoy and eventgate-analytics monitoring through grafana allowed for a quick RCA and resolution once the right people came in
- Resolution was very quick thanks to helmfile deployment
What went poorly?
- First responder was missing the mediawiki debugging knowledge to find the root cause, which could have been detected and remediated before the page
- Did not name an IC
Where did we get lucky?
- There was no user-facing impact
- The right people with the right knowledge were very quickly available
Links to relevant documentation
- Change that caused the increase in logging https://gerrit.wikimedia.org/r/c/mediawiki/core/+/859643
Actionables
- CR Bumping the number of replicas https://gerrit.wikimedia.org/r/c/operations/deployment-charts/+/866612
- CR Reverting the logging increase https://gerrit.wikimedia.org/r/c/mediawiki/core/+/864722
- CR Reverting the replica increase https://gerrit.wikimedia.org/r/c/operations/deployment-charts/+/867597
- An investigation into uneven load-balancing may be warranted https://phabricator.wikimedia.org/T325068
Scorecard
| Question | Answer
(yes/no) |
Notes | |
|---|---|---|---|
| People | Were the people responding to this incident sufficiently different than the previous five incidents? | yes | |
| Were the people who responded prepared enough to respond effectively | no | Flamegraph wasn't in the list of tools known by initial responder | |
| Were fewer than five people paged? | yes | ||
| Were pages routed to the correct sub-team(s)? | yes | ||
| Were pages routed to online (business hours) engineers? Answer “no” if engineers were paged after business hours. | yes | ||
| Process | Was the incident status section actively updated during the incident? | no | |
| Was the public status page updated? | no | non user-facing incident | |
| Is there a phabricator task for the incident? | yes | ||
| Are the documented action items assigned? | no | ||
| Is this incident sufficiently different from earlier incidents so as not to be a repeat occurrence? | yes | I don't know (defaulting to yes if there are no known previous occurrences) | |
| Tooling | To the best of your knowledge was the open task queue free of any tasks that would have prevented this incident? Answer “no” if there are
open tasks that would prevent this incident or make mitigation easier if implemented. |
no | https://phabricator.wikimedia.org/T266216 |
| Were the people responding able to communicate effectively during the incident with the existing tooling? | yes | ||
| Did existing monitoring notify the initial responders? | yes | ||
| Were the engineering tools that were to be used during the incident, available and in service? | yes | ||
| Were the steps taken to mitigate guided by an existing runbook? | no | ||
| Total score (count of all “yes” answers above) | 9 | ||
