Analytics/Wikistats2.0/Map Component
It is expected for the Wikistats 2 team to start development of a map component similar in features and functionality to WiViVi.
Background

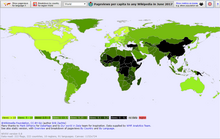
In July 2017, Erik Zachte published a new data visualisation site within Wikistats, WiViVi (Wikipedia Views Visualized), consisting of a clickable choropleth map showing countries by number of visits within a particular WIkipedia language. Upon clicking a country, a tooltip would show the selected language's position in a ranking of that country's Wikipedia pageviews. The Analytics team set as one of the goals for Q2 2017 to develop a component in Wikistats 2 that would allow for a visualisation similar to this one.
Differences between WiViVi and Wikistats 2's map
Scope
The new Wikistats uses projects (e.g. Japanese Wikipedia, Armenian Wikiquote, etc.), as the base of all its metrics. This means metrics per country would be outside the scope of Wikistats 2. Answering questions like "what's the most popular Wiktionary in Germany" in the current design of Wikistats 2 would require a major rethinking of the interface and its purpose. Instead, we aim to answer questions that have projects as their cornerstone, such as:
- How alive is the editing community in Amharic Wikipedia?
- How much data is being added or removed from Greek Wikiquote every month?
- Is viewership of Basque Wikipedia stagnant?
Or, more importantly for the map component,
- Which are the countries outside Israel reading Hebrew Wikipedia the most?
- Which countries have low viewership in a particular language even though it's the most spoken in that region?
Wikiproject breadth
Crucially, WiViVi only displays information of the top 182 Wikipedias out of a total of 288. Wikistats 2 aims to provide metrics for not only all the Wikipedias, but every Wikiproject (Wikitravel, Wiktionary, Meta-wiki, Wikidata...), totalling almost one thousand projects.
Backend constraints
WiViVi is built upon static data that is periodically regenerated. This means it can enjoy much richer data (like language rankings for each country) as it doesn't need to be produced in real time. Wikistats 2, on the other hand, relies on live queries to the Analytics APIs that makes querying all the data currently present in WiViVi not possible with just one data request.
UI options
Option A: Adding a new Reading metric, called Pageviews by Country

This is the option that would require the least amount of rethinking the design of the WIkistats UI. The map would be its own metric, without any breakdowns (as it is already broken down spatially), and it would have by default a map component in Vue, using the original design made in the consultation phase.
It would require to design and build a new map dashboard widget.
Option B: Including the map view in the current Pageviews metric

This would entail adding a new visualisation type to the chart modes allowed in a metric. But since we need more data to represent pageviews spatially, we would have to change the design of the metrics to allow for a secondary API endpoint to get a map, ending the convention we had so far that each metric had one API endpoint.
The exciting part of this visualisation type is to re-use the already available data from the pageviews metric to include it in the map as a time range selector with a line graph (see second possible design).
This option has also the caveat of visibility. To reach this potentially very important part of WIkistats the user would have to know that in order to get to the pageviews by country metric they have to enter the normal pageviews metric and from there switch to the map view with the selector in the top right corner.

Option C: Adding a new map section to Wikistats
There's also the option of adding a new section to the interface, similar to the current WiViVi, and have it as a sandbox to potentially visualise more metrics than pageviews, and also add dimensions such as per capita and global north/south.
Data options
Option A: Tops endpoint
{
  "items":
  [
    {
      "project":"es.wikipedia",
      "start": "2016050500",
      "end": "2017050500"
      "countries":[
        {"country":"Spain","views":592738339,"rank":1},
        {"country":"Mexico","views":2349873,"rank":2},
        ...
      ]
    }
  ]
}
Given a specified date range and project, return the top x countries by number of pageviews. The map component in the UI would translate the country names to their respective polygons in d3.
Option B: Timeseries
This option has the advantage of potential for animated maps/timelines but at the expense of having to perform aggregations on the client, as well as heavier chunks of data.
{
  "project":"es.wikipedia",
  "items":[
    {
      "year":"2015","month":"10","day":"1","country":"Spain","views":592738339
    },
    {
      "year":"2015","month":"10","day":"1","country":"Mexico","views":2349873
    },
    ...
  ]
}
Option C: Tiles
This is the optimal choice if we want to display as much data as WiViVi without static files, but it would require map/cartographic infrastructure that we don't have or want to maintain. But it has interesting potential for spatial visualisation. It would consist on, instead of getting all the data for all countries in one request, divide requests by map position and zoom level and only get data for that particular position.
