
Data Platform/Data Lake/Data Issues/2021-06-04 Traffic Data Loss
| Date issue detected: | 2022-01-26 |
| Start date: | 2021-06-04 |
| End date: | 2022-01-27 |
| Status: | Resolved |
| Phabricator Ticket(s): | https://phabricator.wikimedia.org/T300164 |
Summary
Between June 2021 and January 2022, a number of caching nodes stopped collecting webrequest traffic resulting in an underreporting of pageviews and all related webrequest data (see Affected Datasets).
For pageviews, we estimate this resulted in underreporting global pageviews by 2 to 4% between 4 June and 3 November, and by 5 to 8% between 4 November and 27 January.
Due to the scope of the data loss, we recommend excluding affected traffic from the time period of the loss (June 2021 through January 2022) from analysis and reports.
Description
A number of caching node stopped collecting traffic between June 2021 and January of 2022 in a couple of US data centers. The caching nodes were affected for different time periods depending on the upgrade date, and depending on the node type affected different types traffic data. The table below contains the details of the affected nodes.
| Start date | End date | # nodes | Estimated data loss | Type of traffic | Data centers |
| 2021-06-04 | 2021-11-03 | 1 | 2.8% | webrequest-text, statv, eventlogging | eqiad |
| 2021-10-13 | 2021-11-03 | 1 | 1.0% | webrequest-upload data (mediarequest impact) | ulsfo |
| 2021-11-04 | 2022-01-27 | 3 | 4.3% | webrequest-text, statv, eventlogging | eqiad, ulsfo |
| 2021-11-04 | 2022-01-27 | 3 | 2.2% | webrequest-upload data (mediarequest impact) | ulsfo |
This resulted in an underreporting of pageviews and all related webrequest data (see Affected Datasets).
For pageviews, we estimate this resulted in underreporting global pageviews by 2 to 4% between 4 June and 3 November, and by 5 to 8% between 4 November and 27 January. These numbers are based on global averages. However, the data loss impacted different dimensions of traffic data differently, due to the way that traffic is routed through caching nodes. The most notable differences are due to the way traffic from different regions are routed through caching nodes.
We are not able to provide estimates for the impact on other webrequest-derived datasets.
Regional Implications
Due to the geographic nature of how we collect traffic data, different regions were impacted differently. Pageviews from some regions were underreported by a much larger margin, while pageviews from other regions had no or negligible impact.
Because both affected data centers are in the US, pageview data for the US and other countries that mainly reach us through those datacenters was more significantly impacted.
The data clusters that went down in June and again in November had a more significant impact on US traffic than we saw on global traffic.
We estimate this resulted in underreporting US pageviews by 5 to 9% between 4 June and 3 November, and 15 to 21% between 4 November and 27 January.
Recommendations
Due to the scope of the pageview data loss, we recommend excluding affected traffic from the time period of the loss (June 2021 through January 2022) from analysis and reports. The data should not be used in their uncorrected state.
We recommend the following approaches for excluding or annotating the data from the period of the data loss:
- Date filters to exclude data from June 2021 through January 2022 from analysis
- For time series visualizations:
- Visually block out the period of the data loss
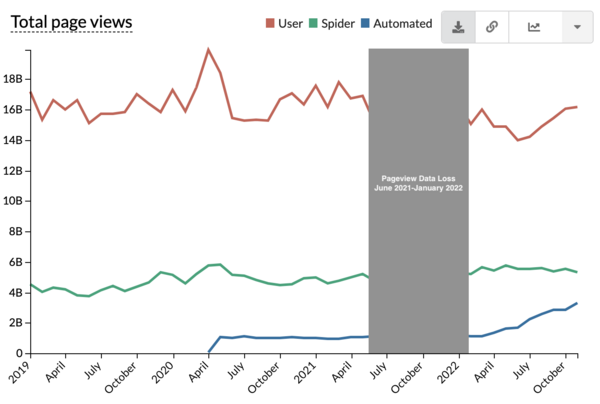
Between June 2021 and January 2022, pageview data was underreported due to caching nodes in the US data centers that had stopped collecting traffic data. For more details see the 2021-06-04 Traffic Data Loss report on Wikitech. Time series graph from Wikistats. - Clearly annotate the data. For users of Superset, an annotation layer is available called “Pageview Data Loss June 2021-January 2022”.

Between June 2021 and January 2022, pageview data was underreported due to caching nodes in the US data centers that had stopped collecting traffic data. For more details see the 2021-06-04 Traffic Data Loss report on Wikitech. Time series graph from Superset, showing annotation layer with mouseover.
- Visually block out the period of the data loss
- When it is not feasible to remove data from an existing report or dashboard, add an annotation or footnote describing the impact of the data loss. For example, for pageview data: Between June 2021 and January 2022, pageview data was underreported due to caching nodes in the US data centers that had stopped collecting traffic data. For more details see the 2021-06-04 Traffic Data Loss report on Wikitech.


Root Cause
A new version of the OS was installed on the affected caching nodes. During the install there was a software version mismatch between varnish and varnishkafka. Varnish was automatically upgraded but varnish kafka needed to be configured manually. This caused the software component called varnishkafka to fail to read the varnish (web cache) shared logs and subsequently publish them to kafka, kafka being the pipeline that delivers this data to the data lake. Puppet code that handles varnish install did not lock in the correct and compatible varnish and varnishkafka versions, but loaded the default version of varnish, which happened to be an older and incompatible version.
Affected Datasets
- Web Requests (webrequest)
- Pageviews (pageview_hourly, pageview_actor)
- Browser Pageviews (browser_pageview)
- Virtual PageViews (virtualpageview_hourly)
- Clickstream (clickstream)
- Referrer (referrer_daily)
- Unique Devices (all unique devices across different data stores)
- Banner Activity (daily and monthly druid banneractivity)
- MediaRequests (hourly) (affected from 2021-10-13 to 2022-01-27)
- MediaCounts load and archive (mediacounts)
- Mobile App sessions and uniques (mobile_apps_session_metrics, mobile_apps_uniques_daily, mobile_apps_uniques_monthly)
- Aqs and Action Api Request Counts (aqs & apis)
- Wikidata metrics in grafana (specialentitydata_metrics, articleplaceholder_metrics & reliability_metrics)
Followup Steps
Create varnish kafka traffic alerts:https://phabricator.wikimedia.org/T304617- Create annotations in Wikistats: https://phabricator.wikimedia.org/T325256
- Lock in varnish and varnishkafka versions: https://phabricator.wikimedia.org/T304617