
Data Platform/Data Lake/Data Issues
(Redirected from Analytics/Data Lake/Data Issues)
All Subpages of Data Platform/Data Lake/Data Issues
Annotating Superset Dashboards
We recommend the following approaches for excluding or annotating data that contains known data quality issues:
- Use date filters to exclude data from analysis for the affected time period
- For time series visualizations:
- Visually block out the period of the data loss and add annotation with the problem summary and from and to dates. For example:
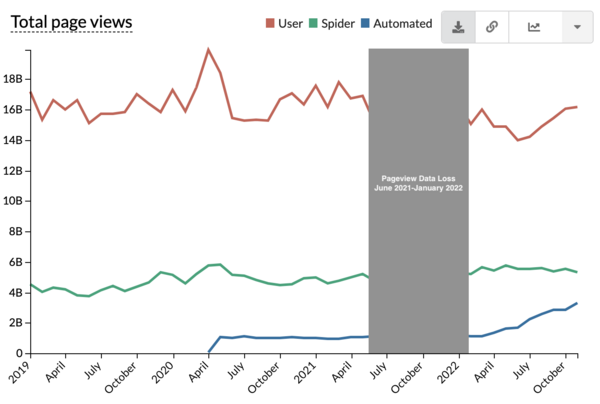
Between June 2021 and January 2022, pageview data was underreported due to caching nodes in the US data centers that had stopped collecting traffic data. For more details see the /2021-06-04 Traffic Data Loss report on Wikitech. Time series graph from Wikistats. - Use overlays to annotate the data. For users of Superset an annotation layer can be created and reused. For example, for the /2021-06-04 Traffic Data Loss, an annotation layer is available called “Pageview Data Loss June 2021-January 2022”:

Between June 2021 and January 2022, pageview data was underreported due to caching nodes in the US data centers that had stopped collecting traffic data. For more details see the /2021-06-04 Traffic Data Loss report on Wikitech. Time series graph from Superset, showing annotation layer with mouseover. - For point in time issues, use a data point annotation.
- Visually block out the period of the data loss and add annotation with the problem summary and from and to dates. For example:
- When it is not feasible to remove data from an existing report or dashboard, add an annotation or footnote describing the impact of the data issue.

