
Incidents/20151003-Parsoid
Summary
Around 8:34am UTC on Oct 3, 2015, all servers in the Parsoid eqiad cluster had a spike in CPU usage and memory usage which effectively ground request processing to a halt. This led to icinga alerts around 8:42 am UTC. As individual requests timed out, those stuck workers were killed automatically and the servers started recovering slowly, but the CPU usage hovered in the 60-90% range. Eventually, an hour later (9:38 am UTC), Giuseppe (Joe) did a rolling restart of all the servers in the Parsoid cluster which led to a full recovery.
[08:42:34] <icinga-wm>	 PROBLEM - Parsoid on wtp1017 is CRITICAL: CRITICAL - Socket timeout after 10 seconds
[08:44:04] <icinga-wm>	 PROBLEM - Parsoid on wtp1007 is CRITICAL: CRITICAL - Socket timeout after 10 seconds
[08:44:13] <icinga-wm>	 RECOVERY - Parsoid on wtp1017 is OK: HTTP OK: HTTP/1.1 200 OK - 1514 bytes in 6.033 second response time
[08:44:34] <icinga-wm>	 PROBLEM - Parsoid on wtp1005 is CRITICAL: CRITICAL - Socket timeout after 10 seconds
[08:45:35] <icinga-wm>	 RECOVERY - Parsoid on wtp1007 is OK: HTTP OK: HTTP/1.1 200 OK - 1514 bytes in 0.171 second response time
[08:46:04] <icinga-wm>	 RECOVERY - Parsoid on wtp1005 is OK: HTTP OK: HTTP/1.1 200 OK - 1514 bytes in 0.006 second response time
[08:49:23] <icinga-wm>	 PROBLEM - Parsoid on wtp1010 is CRITICAL: CRITICAL - Socket timeout after 10 seconds
[08:49:34] <icinga-wm>	 PROBLEM - Parsoid on wtp1021 is CRITICAL: CRITICAL - Socket timeout after 10 seconds
[08:50:54] <icinga-wm>	 RECOVERY - Parsoid on wtp1010 is OK: HTTP OK: HTTP/1.1 200 OK - 1514 bytes in 8.731 second response time
[08:51:44] <icinga-wm>	 PROBLEM - HTTP 5xx req/min on graphite1001 is CRITICAL: CRITICAL: 10.00% of data above the critical threshold [500.0]
[08:52:53] <icinga-wm>	 RECOVERY - Parsoid on wtp1021 is OK: HTTP OK: HTTP/1.1 200 OK - 1514 bytes in 8.361 second response time
[08:57:34] <icinga-wm>	 PROBLEM - Parsoid on wtp1008 is CRITICAL: CRITICAL - Socket timeout after 10 seconds
[08:58:24] <icinga-wm>	 RECOVERY - HTTP 5xx req/min on graphite1001 is OK: OK: Less than 1.00% above the threshold [250.0]
[08:59:23] <icinga-wm>	 RECOVERY - Parsoid on wtp1008 is OK: HTTP OK: HTTP/1.1 200 OK - 1514 bytes in 7.986 second response time
[09:11:24] <icinga-wm>	 PROBLEM - Parsoid on wtp1021 is CRITICAL: CRITICAL - Socket timeout after 10 seconds
[09:11:41] <_joe_>	 what's happening to parsoid?
[09:14:25] <_joe_>	 memory exhaustion I'd say
[09:14:35] <icinga-wm>	 RECOVERY - Parsoid on wtp1021 is OK: HTTP OK: HTTP/1.1 200 OK - 1514 bytes in 0.044 second response time
[09:14:35] <_joe_>	 !log restarting parsoid on wtp1021
[09:14:40] <morebots>	 Logged the message at https://wikitech.wikimedia.org/wiki/Server_Admin_Log, Master
[09:15:30] <_joe_>	 nope, more like infinite loops
[09:16:29] <_joe_>	 so ofc restarting parsoid heals it
[09:36:50] <wikibugs>	 �6operations�, �10Parsoid�: All parsoid servers almost unresponsive, under high cpu load - https://phabricator.wikimedia.org/T114558#1699371 (�10Joe�) �3NEW�
[09:38:12] <_joe_>	 !log rolling restarting all parsoids in eqiad
[09:38:17] <morebots>	 Logged the message at https://wikitech.wikimedia.org/wiki/Server_Admin_Log, Master
Relevant graphs
CPU usage graph (recreated from graphite since we didn't take a ganglia dashboard snapshot on Oct 3) (only for wtp1001 - wtp1012, but the spike is fairly clear, rest of the servers had similar cpu usage graphs).
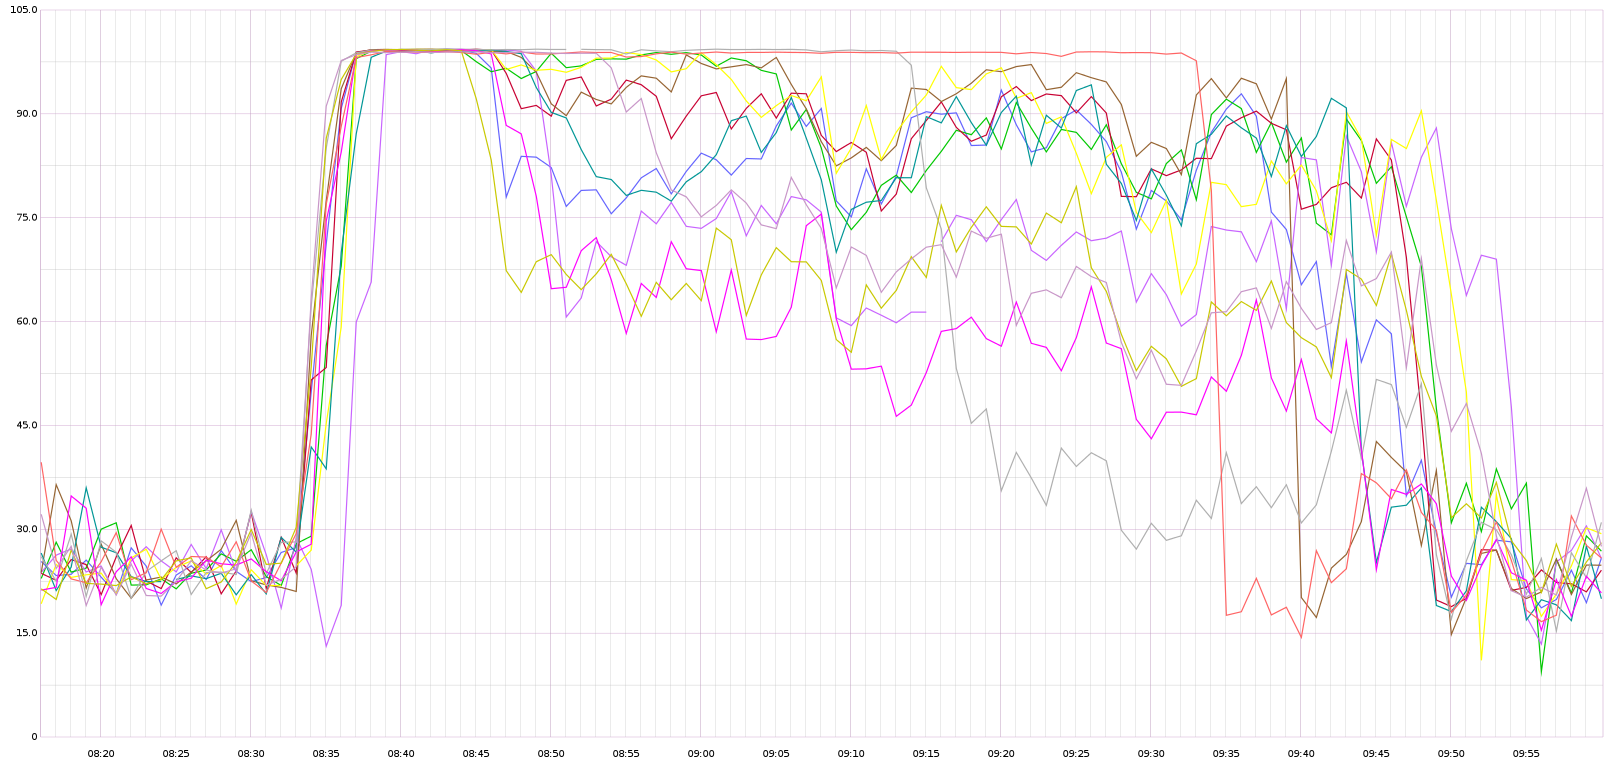
Memory usage graph (from Ganglia)
Analysis
Normally, whenever Parsoid encounters a poorly performing page that is being repeated retried (either by some client, job queue, or browser), the repeated timeouts are recorded in logstash and shows up in the CPU timeout log. This has been the easier way of identifying the problem page which we then replicate locally and then make fixes on the Parsoid end. However, in this case, there was no such title recorded in Kibana. As documented in T114558, replaying all 2000 titles from wtp1001 parsoid logs in the 8:30 - 8:36 UTC time period locally didn't reproduce either the cpu or the memory spike.
However, by looking at all the titles that started parsing and didn't complete parsing, MediaWiki:Coll-attribution-page showed up as a possible culprit. Based on the fact that all servers had a spike around the same time (8:33 - 8:37), Ori looked if there was any title common to all the servers in that time period and MediaWiki:Coll-attribution-page was the only one. Based on RESTBase logs and the sequence of timeouts, Gabriel feels that the theory that Mediawiki:Coll-attribution-page is the cause of timeouts has some basis to it. Verifying this theory is complicated by the fact that Mediawiki:Coll-attribution-page is not a real page but is just an arbitrary page name that OCG uses to convert the potentially large list of authors of a page into attribution text. Since at least November 2014, we've know this page to have been a common source of timeouts.
As of the writing of this incident report, this theory about OCG being the source of the timeouts has not been confirmed yet. Scott downloaded the entire set of 3700+ PDF generation requests from the 8:20 - 8:40 am UTC period which is a huge set to replay (OCG gets 3 requests / second), but this did not cause any spike on the Parsoid cluster. So, it is unclear if OCG requests were indeed the cause of this.
That is the best information we have at this time as to cause of CPU and memory spike. The specific production load scenarios that produced spike are hard to reproduce at this time.
Actionables
- Improve logging to ease identifying the source of such outages in the future
- Pass through user-agent from RESTBase to Parsoid for better correlation of requests with source (Done)
- Include more client info in RESTBase logs (Done)
- This has already yielded results. We had long noticed that failing pages were being retried over 50 times and thus far, it wasn't clear it was coming from. After UA info was added to logs, we found that Kiwix was tagged in all those retries. However, Kiwix was only retrying 5x, and RESTBase retries 2x for each of those (which accounts for a 10x retry seen on the Parsoid end). So, something else in between is the source of those additional retries. Varnish configuration bug is the current suspect.
- Emit graphite events whenever a Parsoid worker restarts with a SIGABRT (T115185)
- Improve robustness of the Parsoid service to not keel over in overload scenarios
- Introduce connection limits in Parsoid (T114855)
- Fix known issues on the OCG end
- Address blockers in the way of decommissioning of the public Parsoid entrypoint (T110474)
- Investigate factors affecting peak memory requirements when parsing large pages.
- Fix OOM errors found in logs during other spikes (T115072 - Done)
- Other bugs found during investigation of this bug report
- Fix O(n^2) scenario in DSR computation in some cases (Done)